
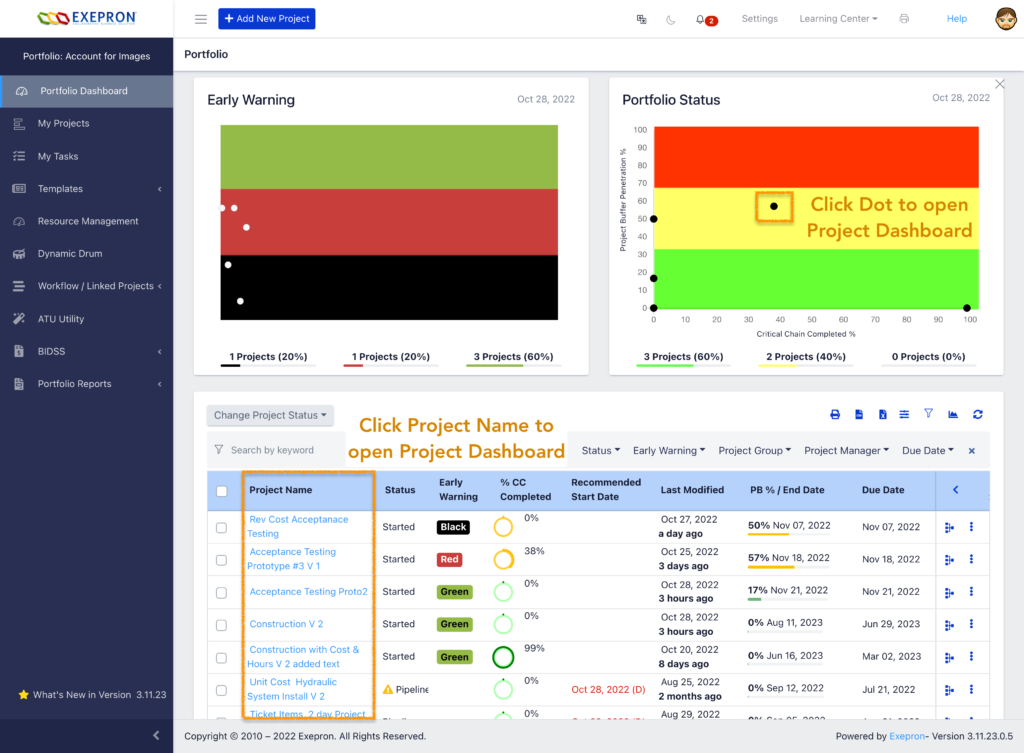
Portfolio Dashboard Overview #
From the Portfolio Dashboard, Navigate to the Project Dashboard by selecting Individual Project by Project Name. Click the Project Name in the Portfolio Table. or click the black dot in either the Portfolio Status chart or the Portfolio Early Warning chart to display the Project Dashboard.
Project Dashboard Overview, short video: Project Dashboard Overview
Project Dashboard for an Individual Project
The real-time Project Dashboard provides an overview of the performance of an Individual Project. #
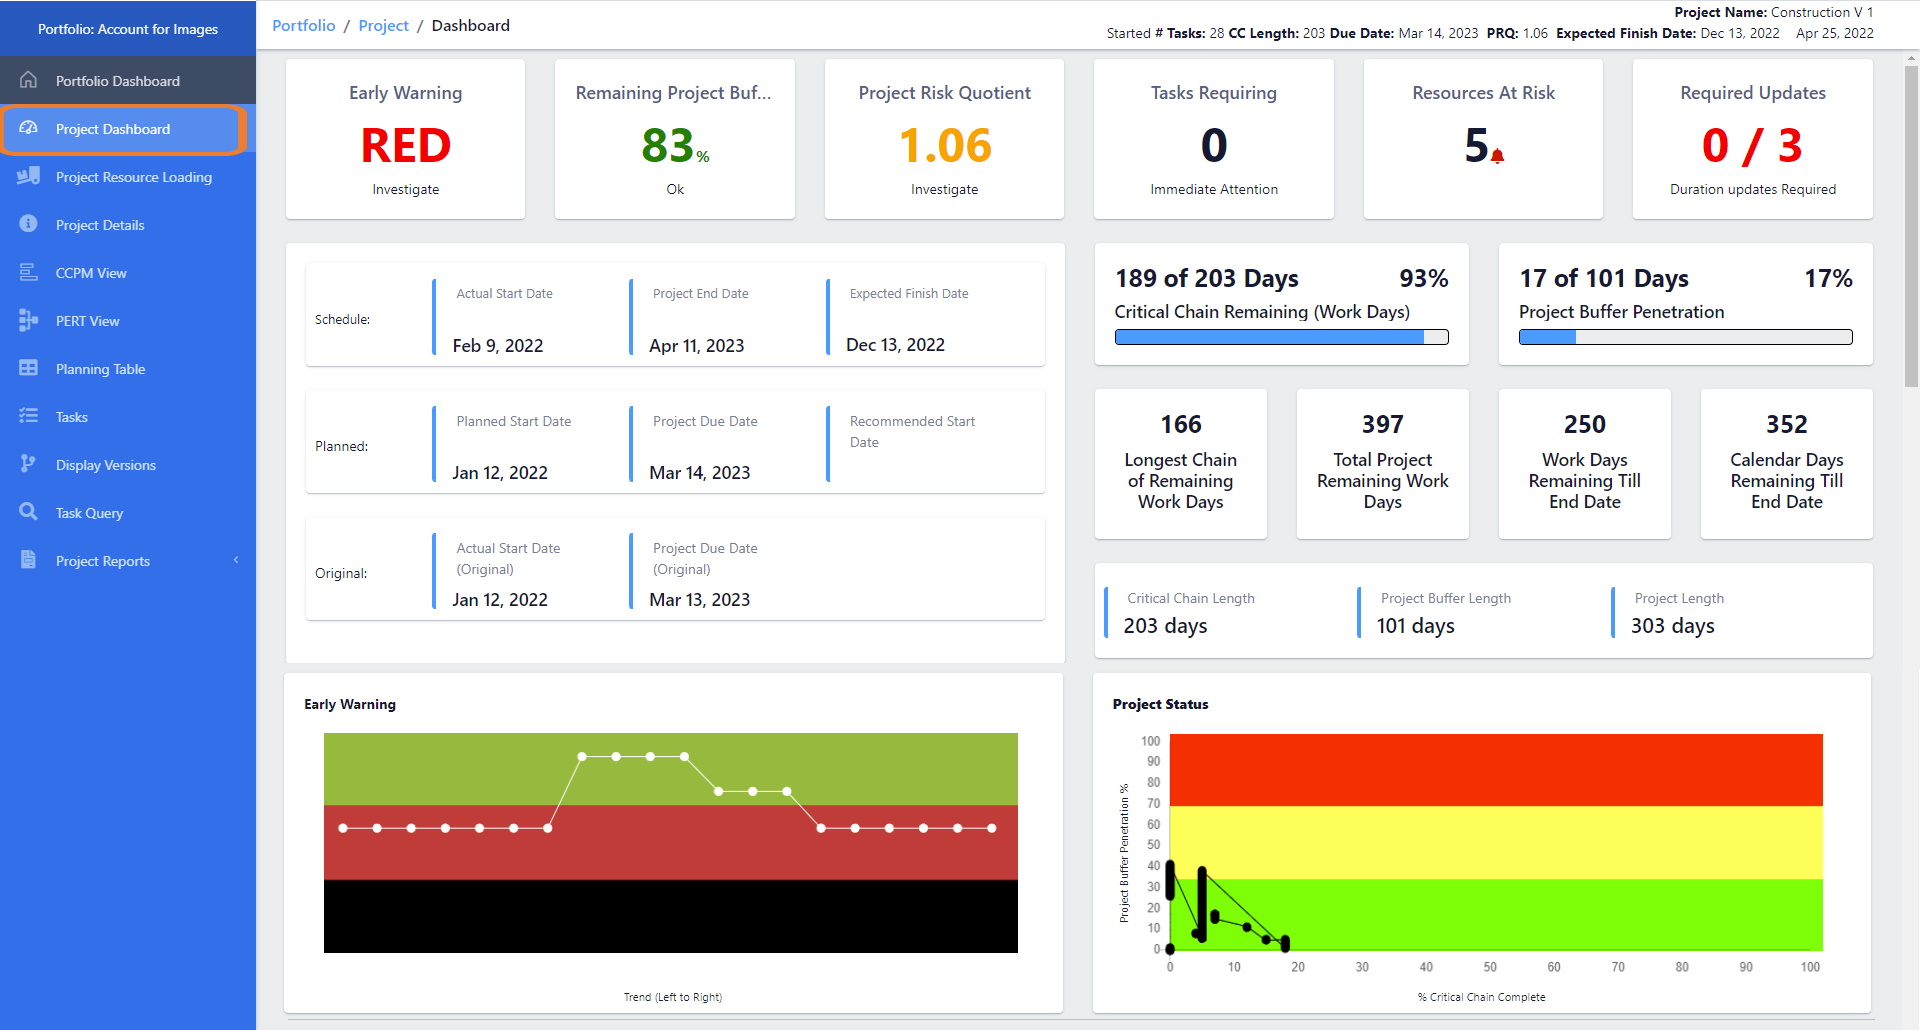
Project Dashboard Flags. #
A summary of the Project’s current Performance and quick access to project items requiring attention.
Click on a Flag will navigate to a deeper layer of information requiring attention.

Early Warning: Current Status, a click will Navigate to the project Early Warning Chart.
Remaining Project Buffer: Current Status, a click will Navigate to the project Project Status Chart.
Project Risk Quotient: An Actionable message Flag indicates the current Schedule Risk and corresponding financial implications.
Tasks Requiring Immediate Attention: Any Tasks in the RED that require attention to bring this project back under control. Clicking the Flag will provide a list of Red Tasks.
Resources at Risk: Clicking this Flag will navigate to a Chart displaying overloaded Resources that Risk delaying and impacting the Portfolio of Projects.
Required Updates: An Actionable message Flag indicating Task requiring an Update. Includes Tasks REquiring Immediate Attention, WIP Tasks, and Tasks due this current Week.
Project Dashboard Dates #
Project Dates are displayed in the Project Dashboard Table.
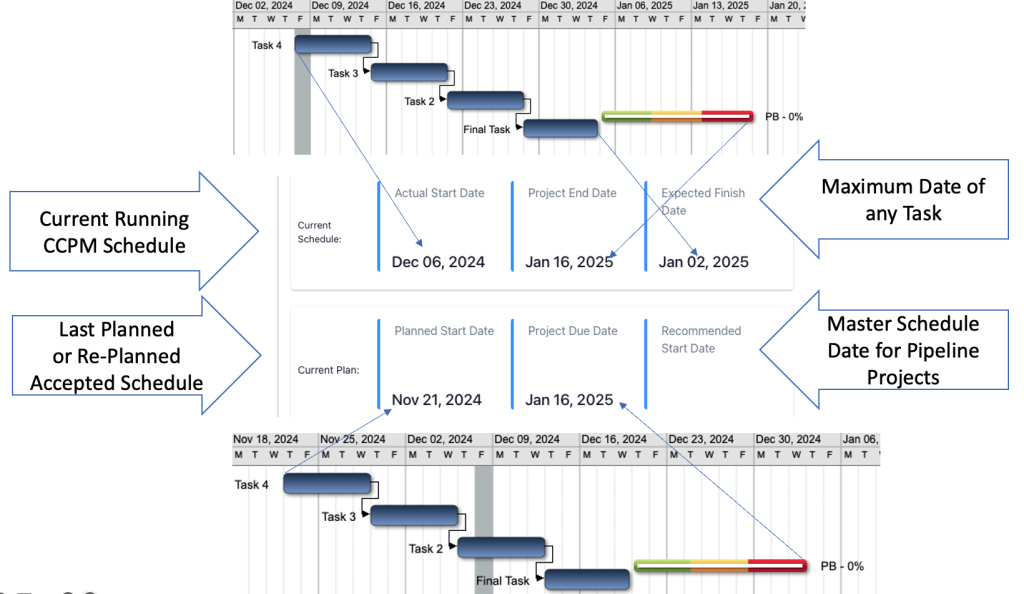
Schedule: Current Project State: #
- Actual Start Date: Projects can start earlier or later than the planned Start Date or on the Master Scheduler Drum recommended Date.
- Projects can be re-planned many times during the execution cycle. The NEW current Actual Start Date will be displayed in the lower row on the table.
- Project End Date: The NEW current End Date (Due Date) will be displayed. If a Project is “Started” earlier than the recommended start date, the
entire project will slide to the left on the timeline. If a Project is “Started” later than the recommended start date, the whole project will slide to the right on the timeline. - Expected Finish Date; Project End Date: If a Project is scheduled to finish earlier or later than the Project End Date, then the Expected Finish Date is the maximum date of the Task ‘pushed’ furthest to the right on the timeline. This maximum Task finish date can be the Final Task or any other Task whose finish date exceeds the Final Task Finish Date.
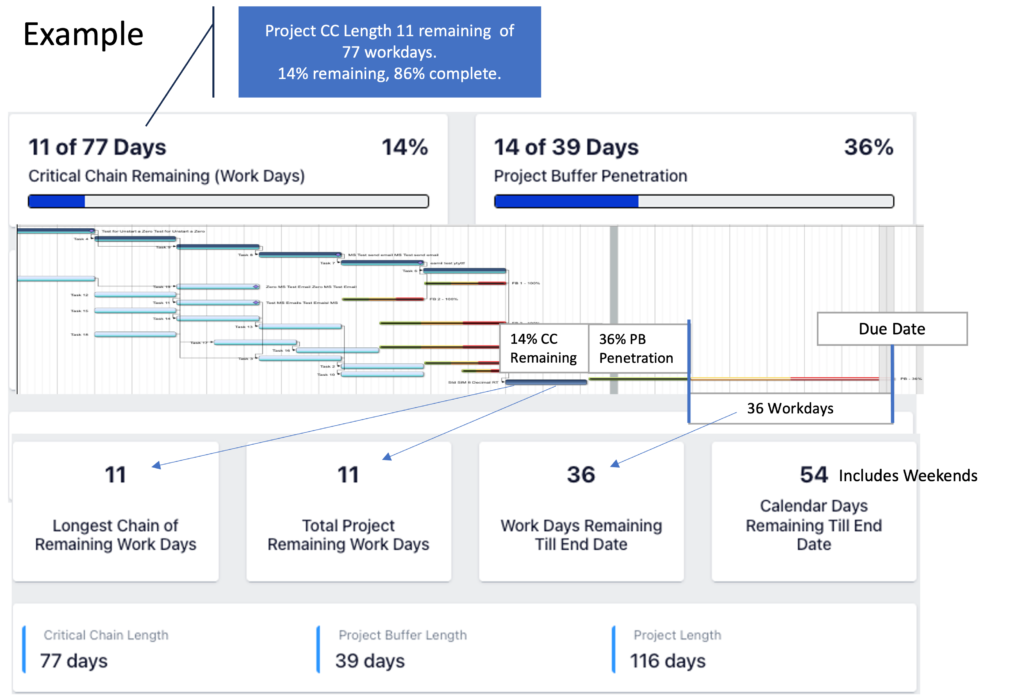
Project Dashboard: Remaining Duration. Critical Chain (CC) Completed and Remaining CC #
Planned: Planned State of the Current Project: #
- Planned Start Date: the current version’s Planned Start Date. The last time the project was scheduled, the status changed to “Accepted.”
- Project Due Date: the Planned Project Due Date. The last time the project was scheduled, the status changed to “Accepted.”
- Recommended Start Date: If the project participated and scheduled using the Master Scheduler Drum and “Drum Accepted,” this is the Recommended Start Date for this project.
See the Project History Log to review the number of times the project might have been replanned. Project Dashboard / Reports / History Log.
- Longest Chain of Remaining Work Days – Refers to the critical chain, the longest chain of task and resource dependencies in a project, and given current progress, it is the remaining time required to complete the project.
- Total Project Remaining Work Days – Refers to the sum of ALL remaining work days across the project’s tasks. It accounts for the projected duration of all outstanding activities necessary to complete the project.
- Work Days Until End Date – The number of active working days (e.g., Monday-Friday or as defined in the project calendar) until the project’s expected end date. This excludes weekends and non-working days unless specified in the project calendar settings.
- Calendar Days Remaining Until End Date – The total number of ALL days, including weekends and holidays, until the project’s expected end date. This provides a complete chronological countdown to project completion.
Early Warning and Project Status Charts: #
The Early Warning is a future view of the probable Project performance. This answers the critical question: “Given the future workload, is there
enough time remaining to complete the project within the planned Due Date?”
Decision-making can now be based on leading indicators and real-time information.
The Early Warning Chart displays the last ten (10) updates. A real-time white dot will be generated when updating the remaining Task duration. If the User neglects the daily update Tasks for “Started” projects, Exepron will automatically advance the calendar overnight; this may cause Buffer penetration.
The Exepron Overnight Calendar/Clock is set to your local International Time Zone.
The Project Early Warning Chart is an intelligent nine-variable algorithm, including Resource Loading, Buffers, and Project Network analysis, among other variables.
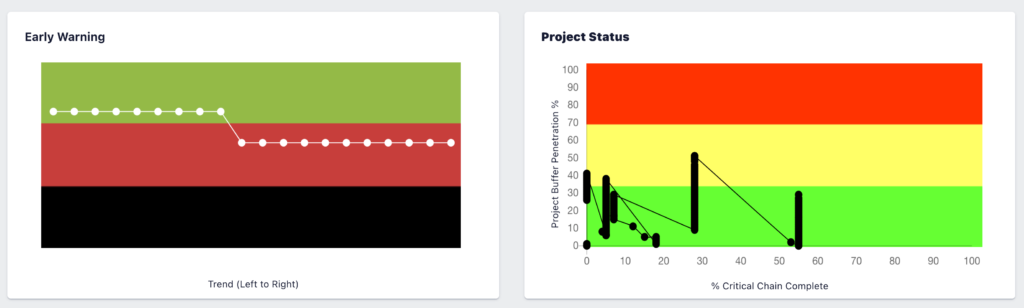
The three colored zones, Green / Red / Black, indicate when proactive intervention is required. In combination with the Project Dashboard Table, users can precisely identify the Tasks causing unacceptable performance and where action needs to be taken.
⦁ GREEN: The Project Due Date is achievable as planned.
⦁ RED: The Project Due Date is in jeopardy – analyze and investigate which Task or chain of Task dependency is causing the Red condition, and take appropriate intervention action.
⦁ BLACK: The Project Due Date will not be achieved without immediate intervention and probably at a higher cost and possible project delay.
The Project Status Chart displays the actual progress of execution of the Critical Chain vs. the penetration of the Project Buffer of a ‘Started’ project.
⦁ RED means immediate Attention is required; the project is in trouble.
⦁ YELLOW means Caution; prepare to take action – your team should investigate and create a contingency plan.
⦁ GREEN means the project is tracking as planned.
A black dot will be generated on the Project Status Chart in real time after a Task’s duration is updated.
If the User neglects to update Tasks daily for “Started” projects, Exepron will automatically advance the calendar overnight; this may cause Buffer
penetration, and a new Dot will be generated on the charts.


