The Early Warning (EW) Chart
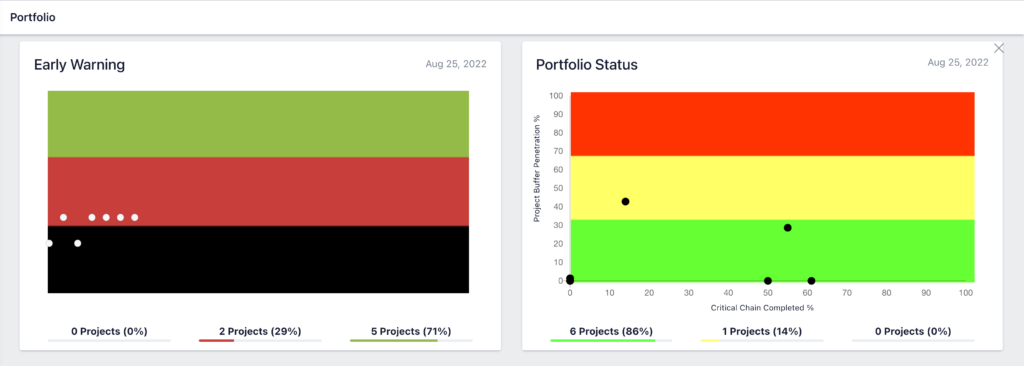
Unique to Exepron and provides a forward-looking indicator displaying the FUTURE expected Project Performance.
The Early Warning embedded intelligence calculates the probability of meeting the Project’s Due Date within the remaining Available Time. Answering the question, “will we run out of time?”.
The Early Warning Chart is an intelligent nine-variable algorithm, including Resource Loading, Buffers, and Project Network analysis, among others.
The Early Warning is an intelligent future view of the probable Project performance. This answers the critical question: “Given the future workload, is there enough time remaining to complete the project within the planned Due Date?”
Decision-making can now be based on leading indicators and real-time information.
The Early Warning Chart displays the last 10 updates. A white dot will be generated in real time when updating the remaining Task duration. If the User neglects the daily update Tasks for “Started” projects, Exepron will automatically advance the calendar overnight; this may cause Buffer penetration. The Exepron Overnight Calendar/Clock is set to your local International Time Zone.
The three colored zones, Green / Red / Black, indicate when proactive intervention is required. In combination with the Project Dashboard Table, users can precisely identify the Tasks causing unacceptable performance and where action needs to be taken.
⦁ GREEN: The Project Due Date is achievable as planned with a 90% probability.
⦁ RED: The Project Due Date is in jeopardy – analyze and investigate which Task or chain of Task dependency is causing the Red condition, and take appropriate intervention action. Displaying 50% probability to recover and deliver on time and within budget.
⦁ BLACK: The Project Due Date will not be achieved without immediate intervention and probably at a higher cost and possible project delay. The probability of meeting both the Due Date and within the Budget is less than 10% and at a high cost in added time and funding.
The Portfolio Status Chart
Displays the actual progress of execution of the Critical Chain vs. the penetration of the Project Buffer of a ‘Started’ project.
⦁ RED means immediate Attention is required,
⦁ YELLOW means Caution,
⦁ GREEN means tracking as planned.
A black dot will be generated on the Project Status Chart in real time after the duration of a Task is updated.
If the User neglects to update Tasks daily for “Started” projects, Exepron will automatically advance the calendar overnight; this may cause Buffer penetration, and a new Dot will be generated on the charts.
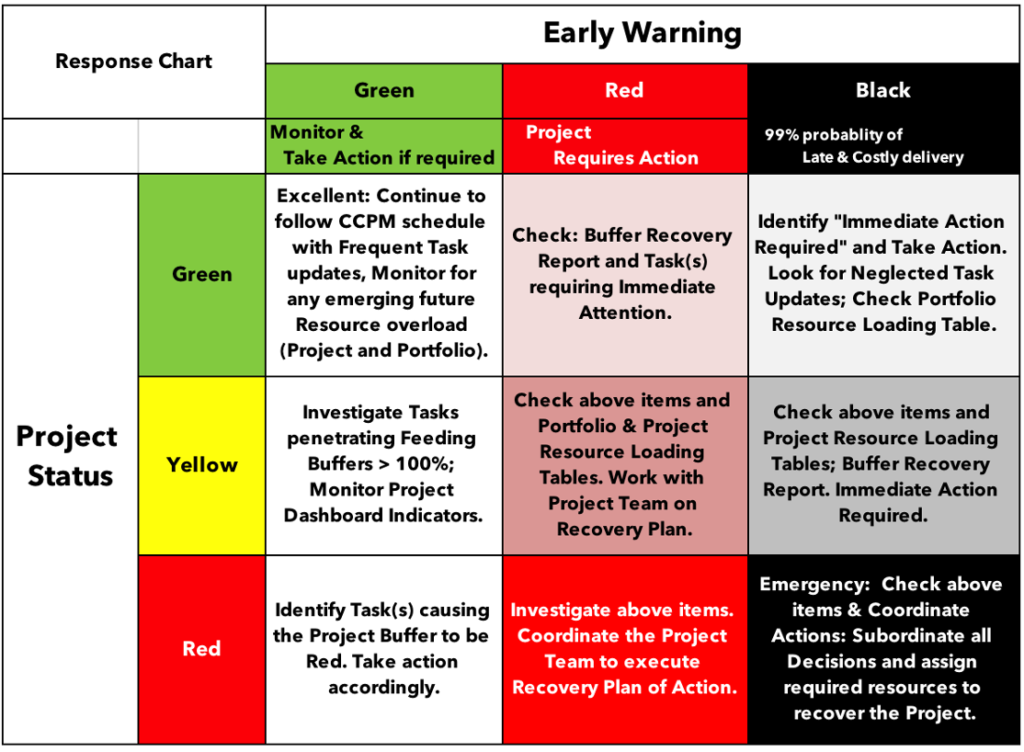
Responding to the Early Warning and Project Status Indicators
Project Dashboard Table
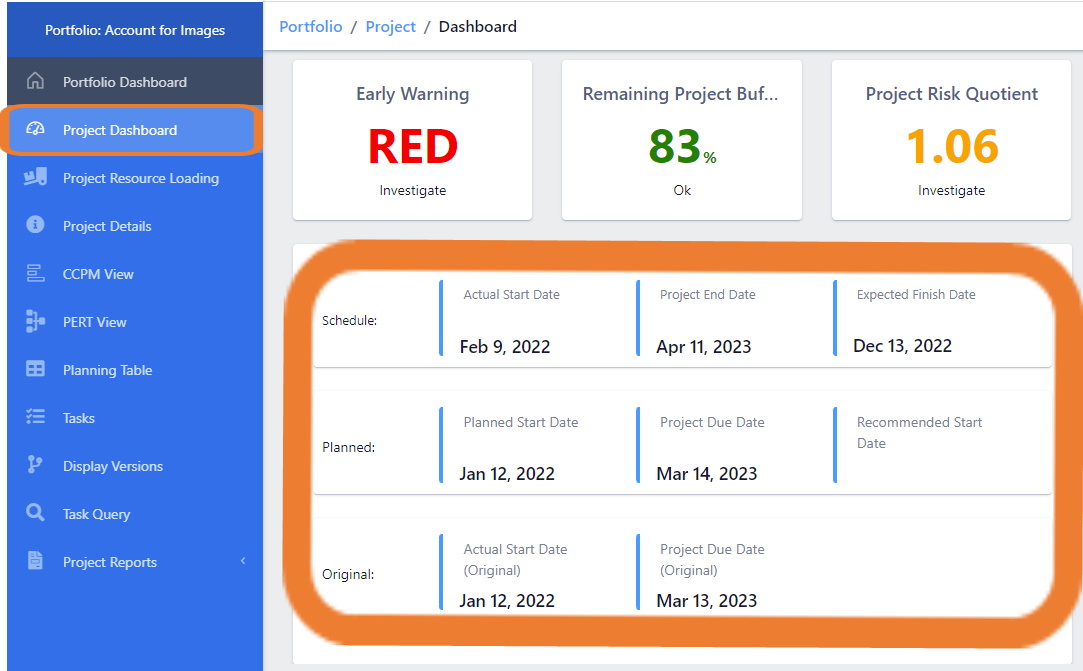
Three sets of Project Dates are displayed in the Project Dashboard Table:
Schedule: Current State:
- Actual Start Date, Projects can start earlier or later than the planned state date or recommended by the Dynamic Drum. Projects can be re-planned many times during the execution cycle. The NEW current Actual Start Date will display in this row on the above table.
- Project End Date, The NEW current End Date will display in this row on the above table. If a Project is “Started” earlier than the recommended start date, the
entire project will slide to the left on the timeline. If a Project is “Started” later than the recommended start date, the entire project will slide to the right. - Expected Finish Date; Project End Date: If a Project is expected to finish earlier or later than the Project End Date, then the Expected Finish Date is the maximum date of the Task ‘pushed’ furthest to the right on the timeline. This maximum Task finish date can be the Final Task or a Feeding Task whose finish date exceeds the Final Task Finish Date.
Planned: In Planning Mode:
- Planned Start Date, this is the first “Accepted” Start Date of this project before Pipelining or Replanning the Project.
- Project Due Date, this is the first “Accepted” Due Date of this project before Pipelining or Replanning the Project.
This is the promised/planned due date for your customer. - Recommended Start Date, in Pipeline Status, and after running the Dynamic Drum, this is the Recommended Start Date.
Original: Start Date and Project Due Date: #
this is the Actual Start Date of the First Task on this Project. The project can start earlier or later than planned and earlier and later than the Dynamic Drum Recommended Start Date.
Note: Exepron’s embedded intelligence will commit the User to execute a Started project in the shortest practical period, possibly bringing the project in ahead of the
original due date.
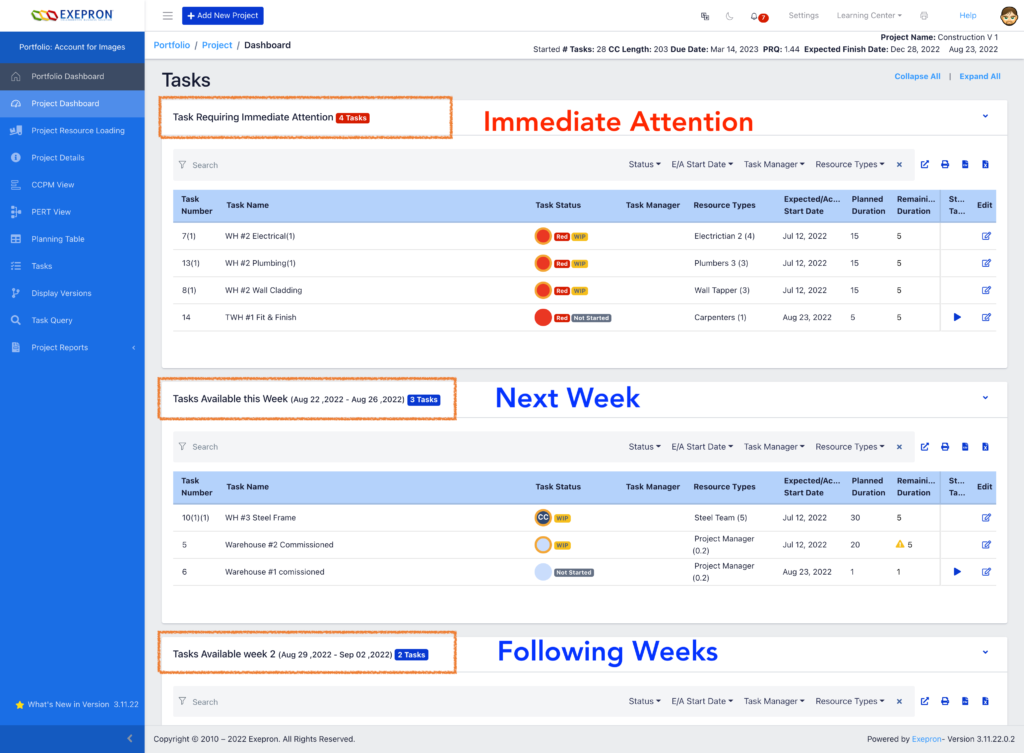
In the Project Dashboard Table, Exepron’s embedded intelligence will display the tasks according to predecessors’ Remaining Duration and the urgency of reducing the potential, accumulating risk of not completing a project on time. Tasks are prioritized and displayed according to the “Push / Pull” rules as preceding Tasks reduce or increase in Remaining Duration.
The Project Dashboard Table displays #
Tasks Requiring Immediate Attention: Critical Chain tasks displaying a red bar or a solid red condition are listed in this row. Feeding Chain tasks displaying a solid red condition are listed in this row.
Tasks Available by Date range: These tasks displayed are scheduled to be worked on in a specific week.
Tasks Available By Week: These Tasks displayed have no Predecessors and are available to be worked on.
Exepron Dashboards, tables, reports, and charts display real-time information; therefore, every Task update may change a task’s expected/suggested start or finish date.
Update Tasks: Click the Update Tasks button to display the Update Tasks Table that
allows the User to update one or multiple tasks before Saving. In the View/Update Task
table, Tasks are listed in descending order, according to the planned Start Dates of
each Task in the Project CCPM schedule.
Update Tasks in the Project Dashboard Table: Enter the Remaining Days for a specific Task in the Remaining Days column.
Auto-Save: When updating Tasks in the Project Dashboard table, Exepron® will Auto-Save the changes with each Task update.
Users may prefer to conduct multi-task updating using the Project Dashboard / Planning Table or CCPM view screens from the left side menu.
In Exepron®, all changes are displayed in real time, and all metrics and reports are updated in real-time depending on your Browser refresh rate.
Tasks should be updated daily to reflect the current Remaining Duration status of a task.
Exepron® CCPM only tracks the Remaining Days required to complete a given Task.
Note: Enter zero Remaining Days when a Task is completed.
Resource Loading Charts
display the Resource Type Utilization Percentage for this Account’s active “Started” projects over a given period.
Note: Users can include Pipeline Projects by clicking “Include Pipeline.”
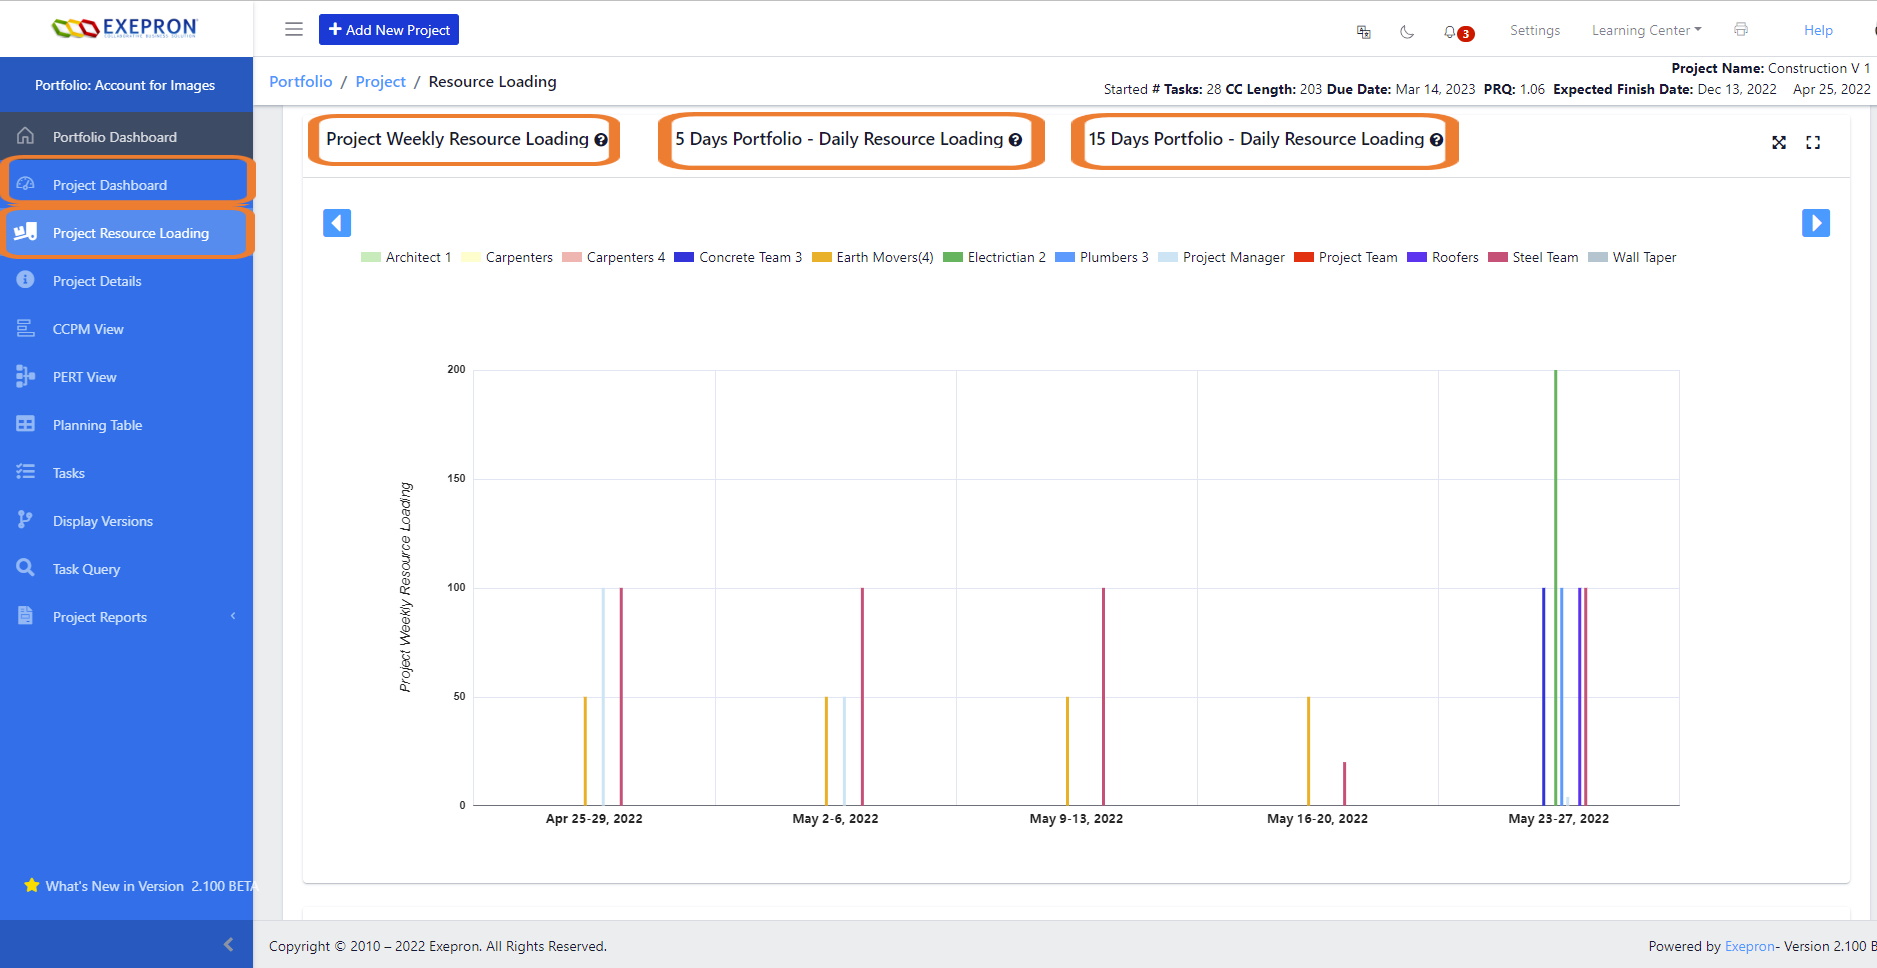
View the Weekly Resource Loading Chart, the 15 days Resource Loading Chart and the Five days Resource Loading chart. Click the “Include Pipeline” to include the Resources from all the “Projects in Pipeline” in the Resource Loading Chart. Click on the blue arrowheads in the chart header to advance to future weeks.
If the Resource Type loading is under one hundred percent, then the chart background is displayed in white. If the Resource Type loading exceeds one hundred percent, then
the chart background is displayed in light red.
Note: It is usual for Resource Loading to exceed one hundred percent for short periods; the User should be checking for trends where there are extended
periods of overloading. Users should not overreact to short spikes of resource overloading.
Include Pipeline: #
Click the “Include Pipeline” to include the Resources from all the “Projects in Pipeline” in the Resource Loading Chart.
Click on the blue arrowheads in the chart header to advance to future weeks.
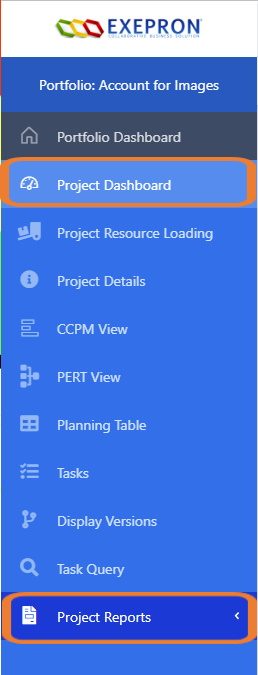
Click the Reports button to view the Individual Project Reports:
Task Aging & Buffer Status Report – displays a real-time Execution schedule for
this project.
Buffer Recovery Report
Project Resource Loading Table
Project History Log
Project Resource Type Work Hours Report (by Permission only)
Cost Summary Report (by Permission only).
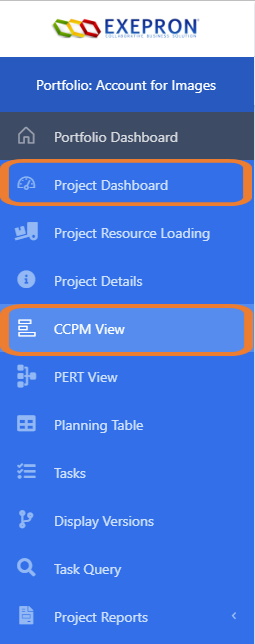
Plan/Schedule #
Click the Plan/Schedule button to navigate this Started project’s Critical Chain Schedule.
Update the Remaining Duration of a Task in the Left table, Exepron will auto-save the changes when clicking elsewhere on the screen.
Click the Task Name in the left table to open the Task Details or double click on the task box on the right side.
Update the Remaining Duration for this Task. Add Notes, Links and Lists
Enter Work hours and Track Costs: Only Users with Permission to
add Work Hours and Costs can access these tabs. View the Task Details section for related information.
Enter the actual hours performed by a specific Resource Type by Name.
Track Costs by Cost Group.
Track Costs by Resource Type, by Name per Task.
Click the “Close Table” icon to increase the CCPM viewing area.
Click the “Open Table” icon to display the left table again.
Click the “PERT” icon to view the PERT in read-only format.
Click the “Open Table” icon in the PERT view to display the Planning Table.
Click the “CCPM” icon to return to the Critical Chain Schedule (CCPM) screen.


