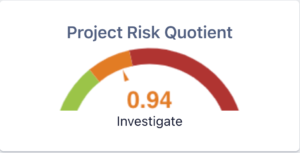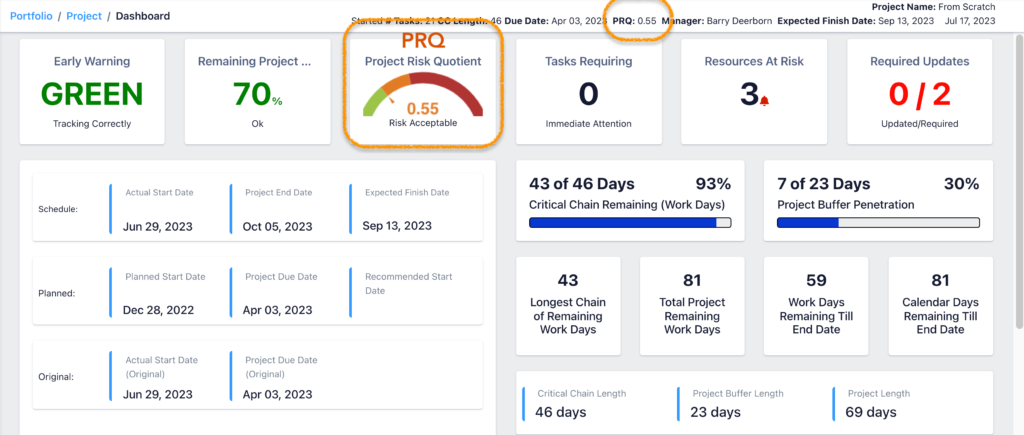
The PRQ Gauge Chart represents the Project Risk Quotient (PRQ).
The PRQ index is a snapshot of a project’s relative risk, which helps assess the schedule risk of an individual project.
Also helpful to compare the schedule risk between all projects in a project portfolio.
The PRQ answers the Critical Question:
Is the project sufficiently protected by Resource Capacity and the remaining Buffer Protection?
Consider Resource capacity as vertical capacity; the higher the ‘vertical capacity’, the shorter the lead time.
Consider Time as horizontal time consumption; the lower the available ‘vertical capacity’, or resource loading, the longer the lead time.
During Planning: What is the relative Scheduling Risk for this project? I should ideally be <0.4, but an acceptable project could be <0.8 if the Execution rules are followed.
During Execution: Is my project at Risk of finishing on Time without penalty? Watch for a high PRQ, above 1.0, which warns of a potential increase in Cost and Time penalties.
A message will appear in the lower portion of the PRQ Gauge Chart indicating if ‘Immediate Action Is Required‘ to salvage a potentially delayed project.
*Scheduling Risk means: Assessing the probability of meeting the project’s planned Due Date without incurring costly corrective actions during execution.
Execution Risk: The PRQ is a leading indicator predicting future schedule risk for the current project – assessment parameters include the Resource Loading and Buffer
conditions of ‘Started’ projects.
The PRQ index will change during Execution; the higher the PRQ, the higher the relative scheduling risk of incurring additional costs or time
penalties.
Users can expect each daily update to influence the PRQ in real time.